
Robyn Deep Dive: What it can and can't tell you
We tested Robyn on 60 synthetic businesses where we know every channel's true return. Uncalibrated, its plans did no better than doing nothing. With five geolifts, it decided as well as PyMC-Marketing and Meridian.
 Entropy Labs · 14 min read
In this article
- How we tested it
- How Robyn works
- Python or R: we ran both and kept R
- Uncalibrated, Robyn overestimates media
- Calibration is what makes Robyn useful
- Fixed coefficients: Robyn averages a channel over time
- An additive world: media adds to the base, it never scales with it
- What this evaluation can and cannot say
- If you use Robyn
Robyn is one of the most used open-source MMMs, and it is usually the first one a team installs. We tested it on 60 synthetic businesses where we know every channel's true return, and we asked one question: if you move budget the way Robyn says, do you sell more?
Uncalibrated, not reliably. In our realistic world, following Robyn's ranking captured roughly none of the available gain, and in half the businesses it lost sales against leaving the budget alone. With five geolifts, Robyn made decisions as good as PyMC-Marketing and Meridian with the same five lifts, and it had the lowest bias of the three.
The rest of this piece covers how Robyn works, which version to run, why calibration matters this much, and two assumptions Robyn makes about the world that no amount of tuning removes: fixed coefficients and an additive response.
How we tested it
We built three synthetic worlds with 20 businesses each. Every business has between 3 and 20 media channels, two or three years of weekly data, prices, promotions and its own margin. Because we generate the sales, we know the true return of every channel and the budget that maximizes sales.
| World | Channels | Weeks | What makes it hard |
|---|---|---|---|
| Clean room | 3 to 5 | 156 | Nothing. Spend is independent of demand; low noise. |
| Real world | 5 to 10 | 104 | Planners raise spend when demand is already coming; channels move together; promotions and competitors change how well media works. |
| Adversarial | 10 to 20 | 104 | The same problems, stronger, plus structural breaks. |
In the harder worlds, media spend moves with demand
r = correlation of weekly spend with demand. The higher it is, the harder it is to tell what media caused.
What changes from world to world is how closely spend tracks demand. In the clean room, spend moves on its own schedule, so a model can see what media adds. In the other two, spend rises when demand rises, and in the adversarial world a break also moves both at once.
We score each model with a regret index. We take the model's channel ranking, shift up to 30% of budget from its worst channels to its best ones (same total budget), and simulate the sales. An index of 0 means the model's plan captured all the available gain; 1 means it did as well as not moving anything; above 1 means following the model lost sales. We report the median across the 20 businesses of each world. We also report bias, the average relative error of each channel's ROAS, against a pass limit of ±30%.
The regret index: how much of the possible gain a plan leaves on the table
Illustrative business. Each plan moves up to 30% of budget, same total. Bars = sales against leaving the budget alone.
Read the index as the share of the available incremental sales a plan fails to capture. Model A's plan gets 6 of the 10 points available, so it leaves 40% on the table: index 0.40. Model B's plan sells less than doing nothing, so its index is above 1.
The worlds are synthetic on purpose. A real business never tells you its true ROAS, so a real dataset can tell you which model fits the history best, but not which one gives the right answer.
How Robyn works
Robyn does not fit one model. It fits thousands and then picks one. Each candidate transforms spend with an adstock (carryover) and a saturation curve, then fits a ridge regression of sales on the transformed media, a Prophet trend and seasonality, and your context variables. An evolutionary search (Nevergrad) proposes the transformation parameters; each candidate is scored on two objectives: how well it fits the history (NRMSE) and how far its media split is from the spend split (DECOMP.RSSD). With lift tests, a third objective joins them: how far the model's channel effects are from the measured lifts (MAPE.LIFT).
Robyn fits thousands of candidate models, scores them and keeps one
Each candidate is one choice of adstock and saturation parameters; lift tests only add a score
Two consequences follow from this design. First, the answer you get depends on how you choose among candidates, a step most users do by eye on Robyn's one-pagers. Second, lift tests in Robyn are a filter on which candidate wins, not a constraint inside the fit. That second point explains most of what happens in the adversarial world.
Python or R: we ran both and kept R
We started with robynpy 0.3.6, the Python port, because the rest of our stack is Python. Before trusting any number, we checked it line by line against R Robyn, and we found one problem that is the port's and three that were our configuration. The table compares the port as we first ran it with R Robyn as we ran it for the study.
| Difference | robynpy 0.3.6 | R Robyn | Whose |
|---|---|---|---|
| Calibration | Not implemented: MAPE.LIFT is hard-coded to 0 and the calibrator is never called | Native, MAPE.LIFT is a third objective | The port |
| Trend and seasonality | Off | Prophet trend and season | Ours |
| Media sign | Not constrained; 7% of channels came out negative | Positive (R default) | Ours |
| Search and selection | 3 trials × 1,000 iterations; first Pareto solution | 5 trials × 2,000 iterations; best cluster representative on NRMSE + DECOMP.RSSD (+ MAPE.LIFT) | Ours |
The calibration one matters most. In robynpy 0.3.6, passing lift tests to the model changes nothing; any "calibrated" Python Robyn run is, in fact, uncalibrated. As Meta's Robyn team has said itself, the Python version is not ready for production use; for now, run R.
Adding Prophet alone moved the port a lot: in the realistic world, its regret index went from 1.21 to 0.84. Every Robyn number from here on comes from the official R package (CRAN), with Prophet, a positive sign constraint and native calibration, run on the same 60 businesses as the other models.
Uncalibrated, Robyn overestimates media
Without lift tests, Robyn did well only where nothing is hard. In the clean room its median regret index was 0.34. In the realistic world it was 1.02, which means its plan did no better than leaving the budget alone, and it lost sales in 50% of the businesses. In the adversarial world it was 0.96.
Five lifts took Robyn from 1.02 to 0.43 in the real world
Regret index, median of 20 businesses per world; line = middle half of businesses. Lower is better.
The errors run in one direction. Robyn's median ROAS bias was +160% in the clean room, +408% in the realistic world and +1,514% in the adversarial one, against a pass limit of ±30%. PyMC-Marketing and Meridian with default settings overestimated too, by +738% and +653% in the realistic world. The cause is the same for all three: when planners raise spend in the weeks demand is already rising, the model sees media and sales move together and gives media the credit. Ridge regression does not protect you from that; it shrinks every coefficient toward zero, but it cannot tell which part of a seasonal peak the media caused. No model structure or setting can untangle this from observational data; only an experiment that moves spend independently of demand, such as a geolift, can. That is why incrementality tests are not optional.
Fit did not help us find the good models. Within each world, the rank correlation between a model's NRMSE and its regret index was 0.10, 0.15 and 0.04 (Spearman, all p > 0.5). A Robyn model that fit the history better did not produce a better plan.
This matters because Robyn's workflow, and much of the guidance around it, steers analysts toward the candidates with the best R² and the lowest error (NRMSE and DECOMP.RSSD). Those scores measure how well a model reproduces the past, not whether its channel effects are right. A model is useful only if its recommendations sell more, and in our data fit told us almost nothing about that.
Calibration is what makes Robyn useful
Five geolifts did more for Robyn than any setting we changed. In the realistic world, its bias went from +408% to +16% and its regret index from 1.02 to 0.43. Our simulated lifts behave like real geo-holdouts: four weeks of test plus four weeks of cooldown, with measurement noise. Robyn received them through its native calibration input, scope total.
Five lifts brought Robyn inside the ±30% bias limit in two of three worlds
Median ROAS bias across channels, before (grey) and after (green) five lifts. Log scale: each gridline is about 3× the last.
With the same five lifts, Robyn's decisions were as good as the Bayesian models' in the realistic world: 0.43 against 0.41 for PyMC-Marketing and 0.42 for Meridian. It was the only one of the three with bias inside ±30%. The caveat is the tail: even calibrated, Robyn left 20% of the realistic businesses worse off than doing nothing, against 0% for PyMC-Marketing and 5% for Meridian.
With five lifts, Robyn matched the Bayesian models in the real world
Regret index with five lifts, median of 20 businesses. Lower is better; 1 = same as not moving the budget.
The adversarial world is where Robyn falls behind. Lifts took its index from 0.96 to 0.88; PyMC-Marketing went from 1.00 to 0.68 and Meridian from 1.15 to 0.58. We think the reason is where the lifts enter the model.
Robyn uses lift tests to choose a model; the Bayesian models fit with them
In PyMC-Marketing and Meridian, a lift is evidence inside the fit: the posterior has to agree with the data and with the experiment at the same time, so the lift pulls the coefficient of its channel, and through it, the rest. In Robyn, a lift is one more score used to rank candidates that were already fitted without it. If heavy confounding means no candidate in the search fits both the history and the lifts, Robyn picks the least bad one, and the lifts cannot pull it further. More iterations widen the search, but they do not change that mechanism.
Fixed coefficients: Robyn averages a channel over time
Robyn gives each channel one coefficient for the whole modeling window. Adstock and saturation are fixed too. The model assumes that a peso in Meta in the first year sold the same as a peso in Meta in the third year, at the same level of spend.
That is rarely true. The same channel changes over two or three years for reasons the data shows only indirectly: demand for the category rises or falls; the team changes creatives, audiences and bidding; a platform changes its algorithm; the business opens stores or changes its catalogue. Each of those changes how much a peso in that channel sells. Robyn cannot see the change, so it returns the average of the channel across the window, and you set next quarter's budget on an average that may not describe the channel today.
One coefficient averages a channel that changed, and overstates it today
Illustrative channel, weekly ROAS over three years. After week 72 the team changes creatives and operation.
In this example, the three-year coefficient says the channel returns 2.32 per peso. In the last year it returned 1.59. A budget optimizer reading the fixed coefficient overstates the channel by 46% and keeps feeding it, at the moment the channel deserves less.
The fixed coefficient has a real advantage: it gives one curve per channel, and one curve is easy to optimize and easy to explain to a CFO. The cost appears in practice. When the business had a regime change inside the data, the usual workaround is to shorten the modeling window (Robyn's window_start and window_end) to the period after the change. That removes the average problem and creates a data problem: a model fit on 12 months instead of 36 has a third of the history to separate media from seasonality and from each other. In our experience, getting a Robyn model that holds up on a business with regime changes takes several rounds of cutting windows and refitting, and it limits how much long-term data you can use.
PyMC-Marketing offers another option: coefficients that change over time (time_varying_media and time_varying_intercept, built on a Gaussian process). The channel's effect becomes a curve over time rather than a single number, and the model estimates how much it is allowed to move. That costs more data per parameter and more care with priors, and we did not test it in this benchmark. But it lets you keep three years of history without assuming that the first year looks like the third. Meridian lets the baseline move over time (knots), while its media effects stay fixed, like Robyn's.
A calibrated lift also helps here, with a condition: a lift measures the channel at the time of the test. A lift from 18 months ago, fed to a model with fixed coefficients, pulls the average, not the present. Run lifts regularly, and give more weight to recent ones.
An additive world: media adds to the base, it never scales with it
Robyn writes sales as a sum: base (trend, season, holidays, context variables) plus each channel's contribution. The same spend in a channel adds the same sales in a slow week and in the peak of the season. Price, promotions and competitors enter as more terms in the sum, so they can move the base, but they cannot change how well media works.
Most businesses we work with do not behave like that. A peso of media sells more in December than in February because there are more people ready to buy; a promotion makes the same ad convert better; a competitor that doubles its spend makes yours work worse. In our simulator, sales are base × (1 + media), and media is gated by promotions, distribution and competitive pressure.
The same spend sells more in a peak week, and an additive model cannot say so
Illustrative weekly sales, same media spend in both weeks. Grey: base demand. Green: sales from media.
When the world multiplies and the model adds, the model has nowhere to put the extra sales of the peak weeks. It gives them to whatever also rises in those weeks, which is usually spend. In our clean room, changing only that assumption in the same model moved ROAS bias from +340% (additive) to +130% (multiplicative).
The steel-man: the multiplicative form is not free. If your business is closer to additive, a multiplicative model is wrong in the other direction, and we confirmed that in a pre-registered test with an additive world. What held in both worlds was calibration: with five lifts, both families made good decisions whether the world added or multiplied. That is the practical reading for Robyn users. You cannot change Robyn's structure, but you can correct its numbers with experiments, and the experiments do not care about the model's algebra.
What this evaluation can and cannot say
What Robyn does well, in our data: it shows you every candidate it tried and why it ranked them, its calibration works in R, and with lifts it reached the lowest bias of any model we ran in the realistic world. What it cannot do: represent a channel whose effect changes over time, represent media that scales with demand, or use a lift as more than a filter on candidates.
The limits of our test:
- Synthetic worlds. They are built to look like the businesses we see, but they are ours. A world where spend does not follow demand would flatter every model.
- Our simulator is multiplicative. That is deliberate: we think real businesses multiply, with effects that drift over time and channels and events that change each other's returns. It still puts Robyn's additive structure at a disadvantage before calibration. We say so above, and the pre-registered additive test is our check on it.
- A fixed selection rule. We pick the cluster representative with the best combined score. A real analyst picks by reading Robyn's one-pagers, which no benchmark can reproduce. A good analyst may do better than our rule; a hurried one, worse.
- One configuration. Geometric adstock, Hill saturation, 5 trials × 2,000 iterations, no holidays (our dates are synthetic). Weibull adstock or a longer search could change some numbers.
- Intervals are not comparable. Robyn's intervals are the spread of ROI across models in the chosen cluster, not posterior uncertainty, so we do not compare its coverage with the Bayesian models'.
- What we did not save. For this run we kept each model's summary metrics, not its per-channel estimates, so we cannot yet show where in the channel ranking Robyn's errors sit.
- The sign flip is unexplained. The Python port, as we first ran it, underestimated media (−56%); R Robyn overestimated it (+408%). Four things changed between the two runs, so we cannot attribute the flip to any one of them.
If you use Robyn
- Run R Robyn. Until the Python port implements calibration, use the CRAN package. If you must use the port, confirm in your version that MAPE.LIFT is not a constant.
- Turn on Prophet and keep the positive sign on media. Without trend and season, ridge splits seasonal demand between the intercept and media inconsistently.
- Do not choose by fit. NRMSE did not predict which models made good decisions. Choose among candidates that agree with your lifts.
- Calibrate before you move budget. Five lifts took Robyn from no better than doing nothing to the level of the Bayesian models in the realistic world. Without lifts, treat its ROAS as a ranking hypothesis, not a number.
- Watch for regime changes. If a channel changed (new creatives, new bidding, a new market), Robyn will average before and after. Cut the window or refresh the lifts, and know which one you chose.
- Expect it to over-credit media in peak season. That is the additive structure. Lifts correct the level of each channel; they do not change the structure, so read peak-season contributions with care.
- In heavily confounded businesses, consider a model where lifts enter the likelihood. In our adversarial world, lifts helped Robyn less than they helped PyMC-Marketing and Meridian.
The question we started with was which MMM to trust. After 120 Robyn fits, we think that question matters less than whether you calibrate. Robyn without lifts made decisions no better than doing nothing; Robyn with five lifts made them as well as the other two. The model you choose sets the ceiling; the experiments you run decide how close you get to it.
Also from Entropy Labs.
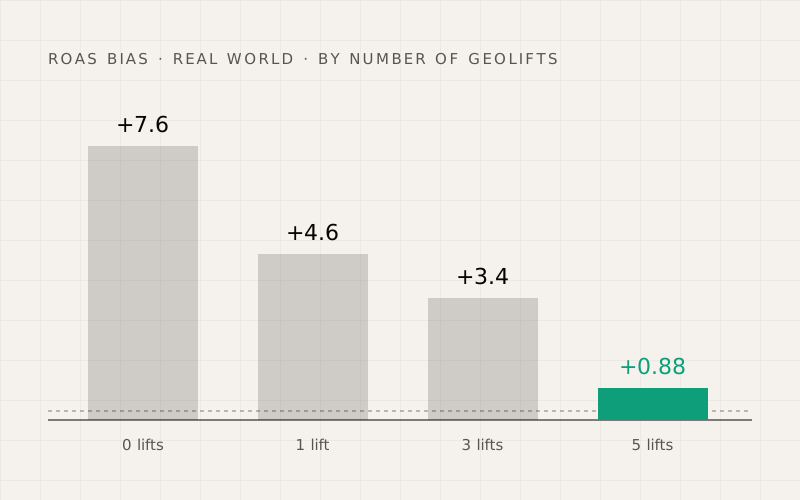 ArticleYour MMM is probably wrong: what we learned calibrating with geoliftsWe built simulated businesses where we know the true ROAS, then graded the popular MMMs against it. Five geolifts cut PyMC's bias from +7.6 to +0.88. Running experiments mattered more than choosing the model.Read the article →
 Study · free PDFMeta in 2026: what works, and what doesn't.10,000+ creatives from 32 brands, every ad judged only against ads from the same brand, campaign and month. Exactly one creative lesson travelled between brands. The full study is a free download.Get the full study →